
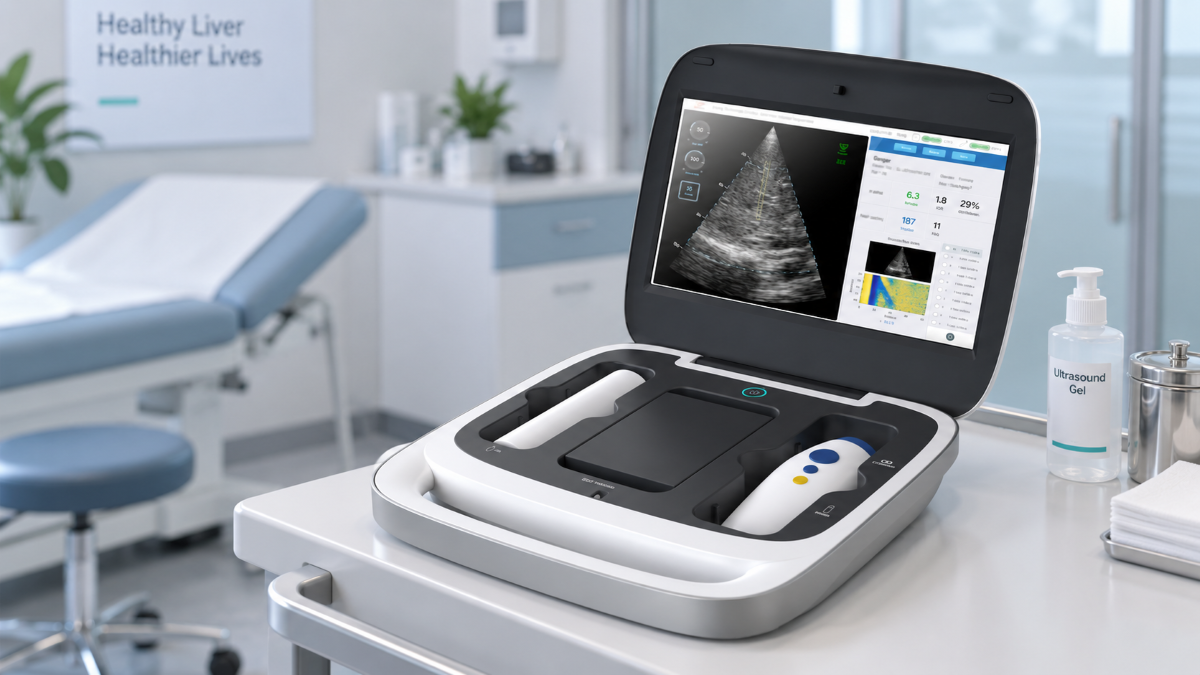
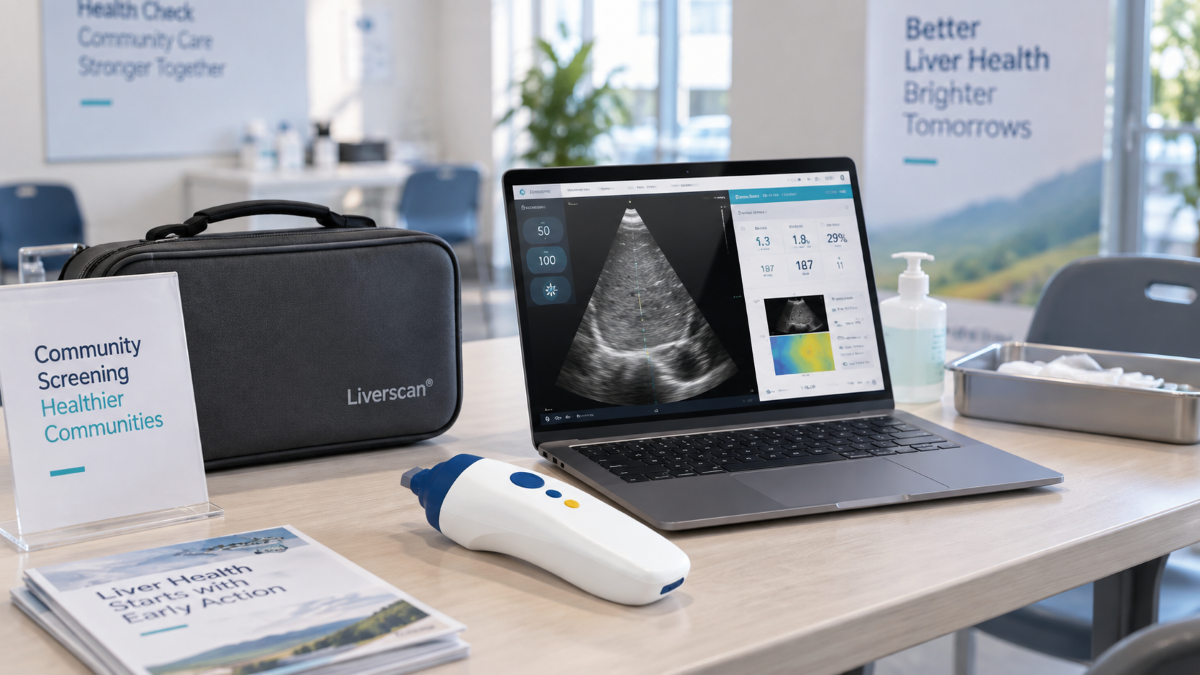
When a hospital, clinic, or screening network compares Liverscan® and FibroScan®, the useful question is not which brand wins. It is which exact configuration can deliver the measurements, workflow, evidence, and support the program needs. FibroScan® is a product family whose functions vary by model. Our Liverscan® platform is available as Liverscan® C, which pairs the wireless probe with a dedicated portable workstation, and Liverscan® Mobile, which pairs the same probe foundation with software for a compatible laptop or Surface device.
For a useful liver elastography device comparison, point-of-care buyers should ask five questions: what the operator sees, how many valid measurements are required, where the evidence stops, how the system fits the care setting, and what the quoted configuration includes. A feature may provide more information or simplify deployment, but it does not by itself prove a better diagnostic result.
Compare the Configuration Your Team Will Actually Buy
A fair comparison starts with model names, software versions, probes, and service packages. Echosens currently markets FibroScan® GO, Mini+ 430, Compact 530, and Expert 630 configurations. Its latest systems may include Guided VCTE®, which uses visual indicators to help identify a measurement location; AutoScan can then trigger 10 valid measurements with one click. Guided VCTE® is listed for M+ and XL+ probes. Availability of spleen stiffness measurement, ultrasound localization, connectivity, and other functions varies by model, market, and quoted configuration.
Those details matter because “FibroScan® workflow” no longer means one fixed process. GO adds a cloud-based, pay-per-exam model; Mini+ and Compact are battery-powered portable systems; Expert is built for higher-volume hospital use and broader specialist assessment. A comparison against an older or unspecified device can therefore mislead a buyer.
Our two Liverscan® configurations use the same probe parameters but differ in the terminal supplied. Liverscan® C provides a portable workstation with pre-installed software and integrated accessories. Liverscan® Mobile is intended for a compatible laptop or Surface. Keep each quotation model-specific because bundled connectivity, training, maintenance, and reporting functions may differ.
Liver Elastography Device Comparison at a Glance
| Decision point | Liverscan® | FibroScan® |
|---|---|---|
| Core measurement | Transient elastography with real-time 2D B-mode imaging in one wireless composite probe | LSM by VCTE®; functions vary across GO, Mini+ 430, Compact 530, and Expert 630 |
| Liver outputs | LSM in kPa and MAP in dB/m during the same examination | LSM in kPa and CAP in dB/m; Expert 630 also supports SSM |
| Guidance | Live B-mode image with an adjustable measurement region | Latest systems may provide Guided VCTE® indicators; localization and specialist options vary by configuration |
| Acquisition workflow | Four valid measurements in the current Liverscan® workflow | Guided VCTE® AutoScan triggers 10 valid measurements |
| Patient adaptation | One composite probe with software-selected standard or enhanced mode | S+, M+, and XL+ probes for different patient morphologies |
| Deployment | Wireless probe; C workstation or Mobile software configuration; local report generation | Portable, cart-based, or office/cloud configurations depending on model |
| Evidence position | Published prospective validation of an AI-enabled prototype developed under the Liverscan® framework | Larger established publication, guideline, training, and service ecosystem |
The table is a starting point. Specialist functions, local regulatory status, data integration, and support may outweigh a single specification.
What Visual Guidance Changes—and What It Does Not Prove
We integrated real-time two-dimensional B-mode imaging into the Liverscan® wireless probe so the operator can view liver tissue before acquisition. The interface displays the liver region and a measurement area that can be adjusted in depth and radial position. This allows the operator to choose visible parenchyma and move the region away from an obvious vessel, cyst, rib shadow, or unsuitable structure before triggering the measurement.
That is a meaningful workflow difference, but we do not treat visibility as proof of a universal reduction in failed examinations. Across the full 1,473-participant population, the measurement failure rate was 1.1% for AI-POC-TE and 1.2% for conventional TE; 1,455 participants contributed paired valid measurements. The evidence supports saying that B-mode guidance provides anatomical information during targeting. It does not support saying that it eliminates failure or guarantees a first-pass result.
The comparator was a FibroScan® Pro-E without SmartExam or continuous CAP. In a separate 130-patient multicenter study, Guided VCTE® significantly increased the proportion of patients scanned in under four minutes, with the greatest time benefit observed among participants with BMI ≥35 kg/m². A current evaluation should therefore compare Liverscan® with the FibroScan® configuration being quoted, not with a generic description of conventional TE.
Body habitus should be tested rather than assumed. In the study, the prototype selected an enhanced mode when skin-to-liver-capsule distance exceeded 20 mm. The investigators nevertheless identified obese and pediatric populations as areas requiring further study. Include participants who reflect the population your program will serve in the evaluation.
Four Valid Measurements: The Evidence Behind the Workflow
Our Liverscan® workflow is built around four valid measurements. The evidence needs precise wording because the full 1,593-participant study was not conducted using only four measurements for every participant.
The study included a 138-patient biopsy cohort and a separate 1,455-patient paired-TE cohort. Research examinations collected 10 valid measurements. The investigators then performed an exploratory analysis in the biopsy cohort, recalculating medians from subsets of one through nine measurements and comparing them with the 10-measurement median. They reported that four measurements were statistically non-inferior to 10 for the evaluated endpoints and concluded that at least four acquisitions were generally required. The paper also calls for larger external validation.
This makes four measurements an evidence-informed Liverscan® workflow, rather than a result proven across every population and care setting. In the evaluation, observe how the system defines a valid acquisition, rejects an unsuitable signal, reports variability, and handles repositioning.
Measurement count is only one part of the workflow; AI also supports several stages of acquisition and analysis. The published system description identifies four functions: elastogram quality assessment, shear-wave trajectory detection, automatic measurement-mode selection, and liver-boundary segmentation.
Liverscan® calculates LSM and MAP and generates the report locally, without cloud post-processing for the analysis. End-to-end time still includes preparation, positioning, acquisition, review, and cleaning, so time the entire visit during a demonstration rather than comparing measurement counts alone.
Read the Clinical Evidence Without Treating Correlation as Interchangeability
The most comprehensive published evidence entry point for Liverscan® is the 2026 Liver International study of the AI-enabled point-of-care TE prototype. AUROC indicates how well a test distinguishes patients who meet a defined diagnostic endpoint from those who do not; higher values indicate better discrimination, but each value applies only to the endpoint studied. In the 138-patient biopsy cohort, LSM AUROCs were 0.79 for significant fibrosis (F2 or higher), 0.79 for advanced fibrosis (F3 or higher), and 0.97 for cirrhosis (F4). The system’s MAP fat-assessment result produced AUROCs of 0.92 for steatosis at S1 or higher, 0.70 for S2 or higher, and 0.76 for S3.
For procurement teams, the practical conclusion is that performance was endpoint-specific. The 0.97 result applies only to F4 cirrhosis in this cohort; it should not be presented as “97% accuracy” or generalized to every fibrosis stage, patient group, or deployment setting.
In the 1,455-patient paired cohort, liver stiffness values from the two TE techniques had a Pearson correlation of r=0.86, while MAP and CAP had a correlation of r=0.80. These measure association, not identical results. For liver stiffness, Bland–Altman analysis reported a mean bias of 0.6 kPa with limits of agreement of approximately ±5 kPa. Median IQR/median was higher for the AI-enabled system than for conventional TE in that cohort, at 21% versus 12%.
The paper found comparable diagnostic performance between the studied AI-enabled system and conventional TE for selected endpoints. It did not establish superiority, universal diagnostic equivalence, or interchangeable thresholds. It was also a single-center study using a prototype developed under the Liverscan® framework.
For buyers, the practical lesson is straightforward. Interpret LSM with the validated protocol and cut-offs appropriate to the device, disease context, and clinical pathway. MAP and CAP use different attenuation architectures: the study describes MAP as a spatially averaged, multi-domain analysis using 32 radiofrequency lines. A program should not copy CAP thresholds into a MAP protocol. For longitudinal monitoring, keeping the device model, software version, preparation, and acquisition method consistent is more defensible than switching platforms without a documented bridging plan.
Before a demo, review the full Liver International paper through our Clinical Evidence library rather than relying on a summary metric.
Match the Platform to the Point-of-Care Program
Specialist Hepatology and Hospital Pathways
FibroScan® brings a long-established evidence base, guideline presence, training structure, and model-specific functions. A center requiring spleen stiffness measurement or an existing FibroScan®-based protocol should evaluate the Expert 630 and its exact options. Liverscan® may be relevant where the team values live B-mode targeting, a wireless composite probe, and simultaneous LSM and MAP, but those differences should be assessed against the department’s established pathway.
Primary Care and Outpatient Clinics
Space, staffing, delegation, and same-visit reporting often shape the decision. A 2024 prospective validation reported good-to-excellent intra- and inter-operator reliability for Liverscan® LSM in 60 participants, with ICCs ranging from 0.824 to 0.913 across an experienced operator and a trained novice. This supports evaluating a trained, delegated workflow; it does not establish untrained use or equivalent performance in every primary-care setting. During a demo, verify training requirements, result review, record integration, referral rules, and whether Liverscan® C or Mobile fits the room and IT environment.
Community and Multi-Site Screening
Our product information specifies a rechargeable wireless probe with more than four hours of battery life; it should not be described as an unlimited or all-day power source. Our case studies document field deployment at several scales. The Lujiang cohort enrolled 15,025 residents by September 2025 toward a 30,000-resident target; Wencheng coverage reached 13 villages; and a 12-day Shanghai program used QR-code reports for residents. These are deployment examples, not proof of universal throughput or clinical performance.
Teams planning field programs should test transport, charging, offline operation, user accounts, cleaning, quality checks, report handoff, and clinical escalation. A portable device is useful only when the operating process is equally portable.
Research and Longitudinal Programs
Research sites should lock the device model, software version, fasting period, body position, measurement site, respiratory condition, operator training, measurement count, and quality thresholds before enrollment. In a prospective study of 62 adults, moving from the supine position to seated or standing positions changed measured liver stiffness, although success rate and IQR/median did not differ significantly. A separate 2024 study evaluated measurement site and respiratory condition as additional protocol variables. Together, these studies support pre-specifying posture, measurement site, and breathing instructions. They do not establish interchangeability between devices or software versions; that requires a separate bridging plan. Define how protocol deviations will be handled before comparing results across sites or over time.
Compare Ownership and Integration, Not Just Hardware
Public specifications do not establish total cost. We do not recommend using an unverified percentage saving or payback period in a procurement decision. Instead, normalize each proposal over the same operating period and include the base system, probe package, software or cloud fees, training, preventive maintenance, calibration, warranty, transport accessories, replacement coverage, and local technical support.
Commercial models may change the comparison. FibroScan® GO is presented as a pay-per-exam, cloud-based solution, while Liverscan® performs analysis and report generation locally. Neither is automatically preferable: one network may value cloud-based history and fleet oversight, while another prioritizes offline operation or local data control. Compare included terminals, user accounts, sites, report formats, and device transfers.
Use a Demo Evaluation Checklist, Not a Feature Tour
Ask each vendor to complete the same evaluation:
Identify the exact model, software version, probes, modes, and optional modules.
Show what the operator sees before acquisition and how the measurement region is selected.
Demonstrate how an invalid or low-quality acquisition is identified and handled.
Display individual LSM and MAP values, their medians, IQR/median, success rate, and any other quality indicators.
Time the full workflow from positioning to a finalized report.
Scan a representative range of body types, not only an easy demonstration subject.
Show whether analysis works offline and how reports are exported or connected.
Test battery life, charging, transport, and room-to-room movement.
Provide model-specific regulatory documentation. Liverscan® Mobile and Liverscan® C have separate FDA 510(k) clearances, K233401 and K242496.
Itemize training, software, cloud services, probes, maintenance, calibration, warranty, and local support.
This checklist turns a sales discussion into a repeatable procurement test and exposes configuration differences before implementation.
Frequently Asked Questions
Is Liverscan® the Same as FibroScan®?
No. Both are non-invasive liver elastography platforms, but their hardware, guidance, attenuation parameters, software, and deployment models differ. Liverscan® combines TE, real-time B-mode imaging, LSM, and MAP in a wireless composite probe. FibroScan® uses VCTE® with model-dependent CAP, guidance, probe, connectivity, and specialist options.
Is One System More Accurate?
The cited evidence does not support a universal accuracy ranking. In the Liver International study, results were comparable only for the evaluated endpoints and studied configurations; they should not be generalized to every fibrosis stage, steatosis grade, or patient group.
Can MAP Values Use CAP Cut-Offs?
They should not be treated as interchangeable. MAP and CAP are different attenuation parameters, and the paired-study correlation of r=0.80 does not establish one-to-one numerical equivalence. Use device- and population-appropriate interpretation criteria.
Which Liverscan® Configuration Fits a Mobile Program?
Liverscan® Mobile uses customer-supplied compatible computing hardware, while Liverscan® C includes a dedicated portable workstation, pre-installed software, charging, and integrated accessories. The better option depends on whether your organization prefers a self-contained system or already maintains suitable hardware.
Choose the Device Around the Program
A useful liver elastography device comparison should narrow a purchase decision, not declare a universal winner. FibroScan® offers a mature product and evidence ecosystem with current portable, cloud-connected, guided, and specialist configurations. We offer a Liverscan® platform centered on real-time B-mode targeting, a wireless composite probe, simultaneous LSM and MAP, a four-valid-measurement workflow, local analysis, and two deployment formats.
Request a model-specific Liverscan® demo for your clinical setting. Share patient mix, room constraints, reporting needs, weekly volume, and service expectations. We will demonstrate the workflow—from probe placement to final report—so you can compare it with the FibroScan® configuration on your shortlist.